Oil shipping chokepoints
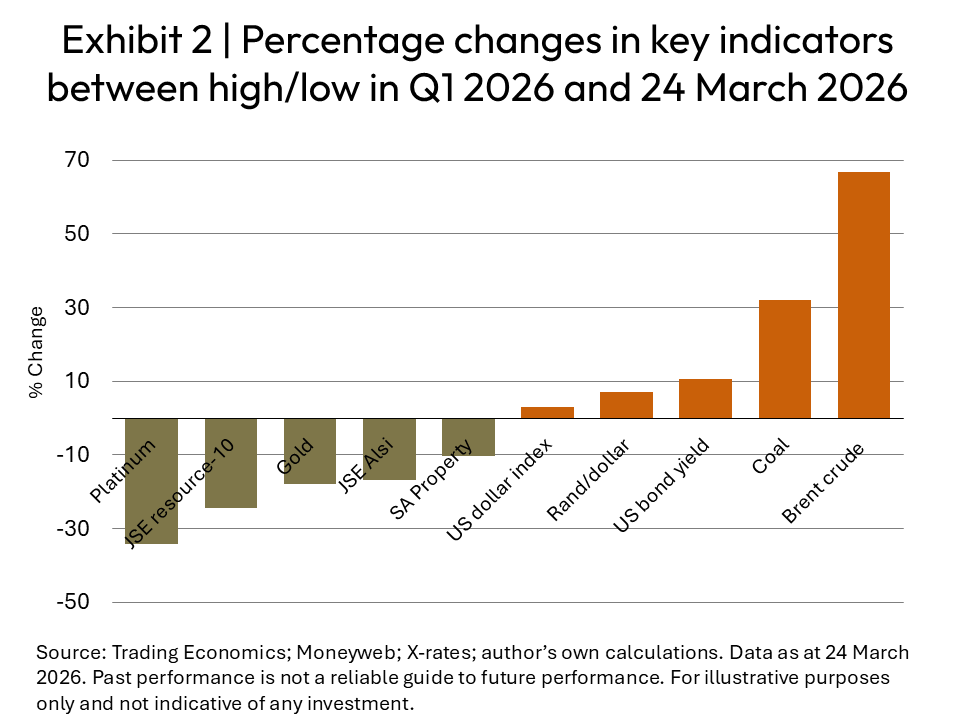
The total world oil and petroleum supply is marginally more than 100 million barrels per day (b/d), of which an estimated 76% travels via seaborne trade. One of the perennial threats to the world economy is the existence of so-called chokepoints, which are defined as narrow channels on global sea routes where large volumes of oil, petroleum products, and liquefied natural gas (LNG) have to pass through. These chokepoints are critical to global energy trade and security, as any blockages can cause disruption to oil and petroleum supplies.
Exhibit 1 illustrates the significance of the seven chokepoints and the sea route around the Cape of Good Hope. Although the Cape of Good Hope is not a chokepoint, it is a major global trade route and a significant transit point for oil tankers and LNG shipments around the world.
According to a report by the South African Association of Freight Forwarders (SAAFF), trade flows are progressively becoming reoriented toward intra-developing market exchanges, supported by Asia-centric value chains and strengthening Africa–Asia and Africa–Latin America linkages, which are offsetting weaker demand from some advanced economies. This has resulted in South–South trade becoming a stabilising force in global shipping.
The war in the Middle East has highlighted the dire need for South Africa to upgrade its port facilities, with Ngqura and Cape Town harbours ranked as the bottom two ports in the world and Durban eighth from the bottom (out of 405 global ports). In the latest cargo update published jointly by SAAFF and Business Unity South Africa, the point is made that South Africa risks underutilising a strategic opportunity arising from shifting global shipping dynamics around the Strait of Hormuz and broader geopolitical disruptions. Failure to improve reliability, efficiency, and ancillary maritime services risks forfeiting these gains to better-performing competitor ports.
Spike in geopolitical risk index
During March 2026, the geopolitical risk (GPR) index constructed by Dario Caldara and Matteo Iacoviello rose to above the level of 300 for only the fifth time since the spikes that occurred around the two world wars.
The most profound spikes in the GPR index during the past eight decades were caused by the following:
- The 1991 invasion of Iraq by a 42-country coalition led by the United States
- The September 2001 destruction of the World Trade Centre by Islamic terrorists. In response to the attacks, the United States launched a global war on terror.
- The 2003 Gulf war in Iraq, aimed at ending Saddam Hussein’s support for international terrorism, conducted by a combined military force from the US, the UK, Australia and Poland.
- Russia’s military invasion of Ukraine in 2022
Market volatility
As a rule, heightened geopolitical uncertainty manifests itself in a higher level of volatility in key economic indicators, most notably affecting exchange rates, equity market indices, trade flows and commodity prices.
Emerging market currencies usually weaken, whilst downward pressure on stock prices tends to be universal. Exceptionally high levels of geopolitical uncertainty pose significant downside risks to the global economy, but commodity price fluctuations may move up or down, depending on the nature of the particular commodity.
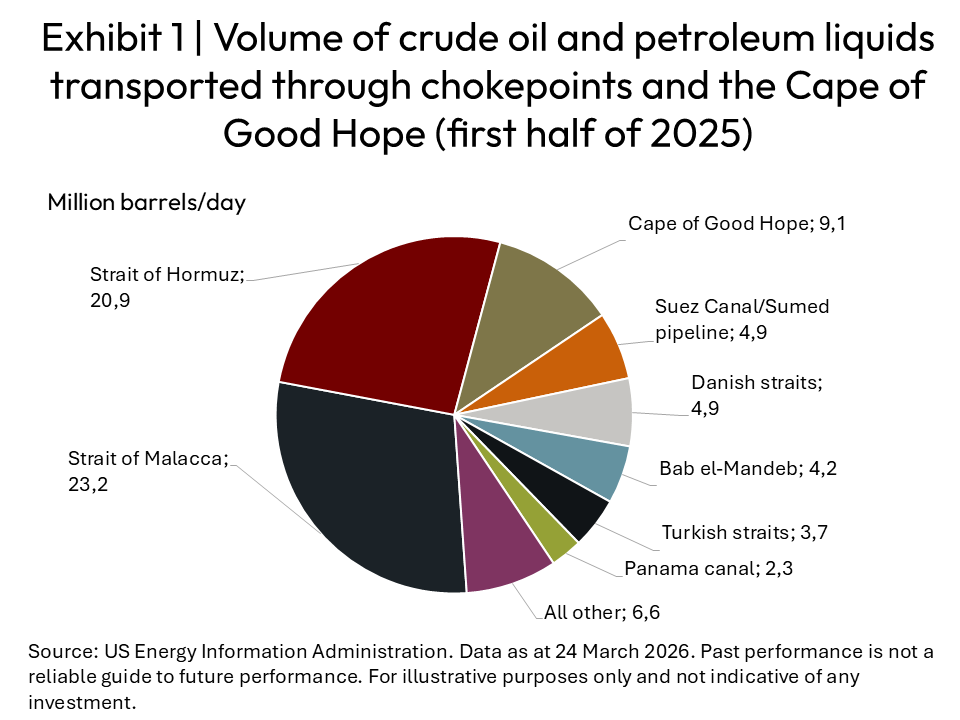
Exhibit 2 illustrates the extent of market volatility following the current war in the Middle East. The changes to the indicators are calculated from their recent highs or lows during the first quarter of 2026 until 24 March 2026. The ones that arguably hold the greatest threat to South Africa are the sharp increase in the oil price and the depreciation of the rand against the US dollar, both of which will place upward pressure on inflation.
The weaker domestic currency is, however, a welcome boon to exporters, who have been battling with an overvalued rand exchange rate against most trading partner currencies during the past 12 months.
In economics, Newton’s Law is more often than not turned on its head – what goes down, must go up again! This will hold true for most key indicators that have been negatively affected by the most recent spike in geopolitical uncertainty following the hostilities in the Middle East. Indicators that have spiked because of the war in Iran are bound to return to their pre-March levels, especially the oil price and energy stocks.
Importantly, the so-called Group of Seven (G7) nations collectively hold an estimated one billion barrels of oil reserves, with the International Energy Agency already having put in place an agreement with its members to release 400 million barrels of oil reserves – enough to cover the loss of oil shipped via the Strait of Hormuz for 20 days.
An early and lasting ceasefire in the Middle East is likely to lead to a quick reversal of most of the trends depicted in Exhibit 2. In the interim, the extent of this unnatural and temporary volatility has created a unique opportunity for fund managers to realign their portfolios in such a way that they capitalise on imminent future corrections, especially with regard to the rand exchange rate and listed stocks.