Monthly macro and economic insights report
Our monthly To the Point column by economist Dr Roelof Botha offers in-depth analysis and commentary on the latest economic trends, market developments, and financial news. Designed to keep you informed and ahead of the curve, each edition delves into key economic indicators, explores their impact on global and local markets, and provides insights to help you navigate the ever-changing economic landscape
Rand strength continues
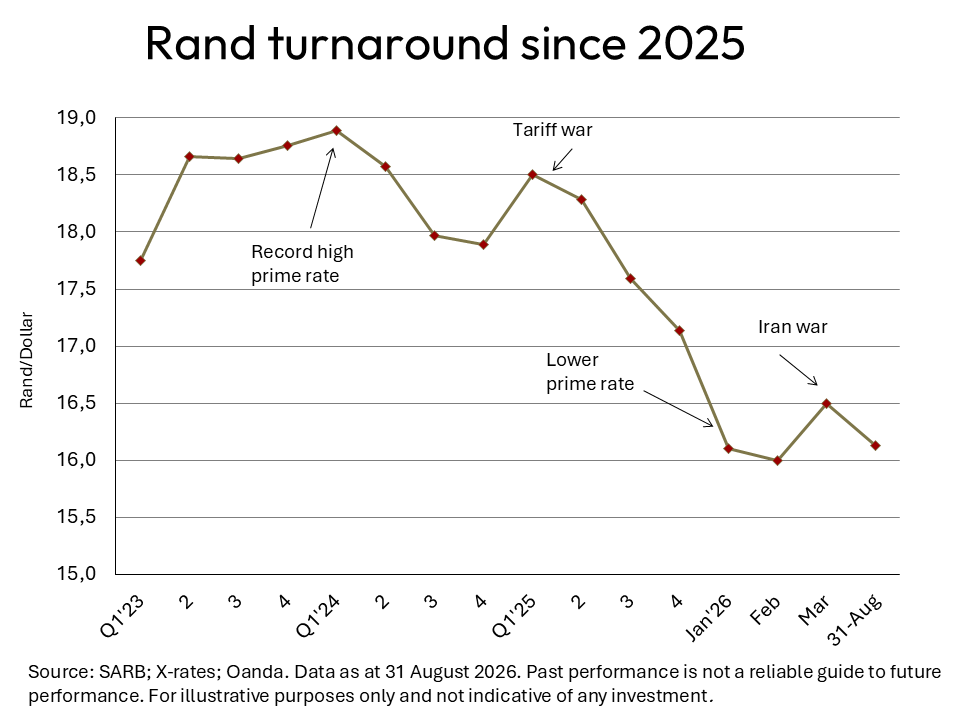
The rand continues to outperform most other currencies of note, with a hugely impressive track record over the past 20 months. Since the beginning of 2025, none of the currencies of South Africa’s key international trading partners has managed to outperform the rand, which managed to strengthen against the currencies of nine of the world’s ten largest economies.
Over the past 20 months, the appreciation of the rand has hit double-digit figures against the US dollar, the Japanese yen and the South Korean won.
| Strengthening of the rand exchange rate against selected key currencies between 1 January 2025 and 31 August 2026 | |||
| % | % | ||
| Japanese yen | 18.7 | British pound | 7.9 |
| US dollar | 17.0 | Chinese yuan | 7.7 |
| South Korean won | 12.2 | Euro | 4.4 |
| Chilean peso | 9.6 | Australian dollar | 1.2 |
| Sources: X-Rates; author’s own calculations. Data as at 31 August 2026. Past performance is not a reliable guide to future performance. For illustrative purposes only and not indicative of any investment. | |||
The major reasons for the extraordinary strength of the rand exchange rate over the past 20 months may be found in a number of fundamental macroeconomic indicators. These are:
- South Africa’s trade account with the rest of the world has continued to produce a handsome surplus over the past five years. Before the global economic upheaval experienced during 2020 and 2021, South Africa’s exports only barely managed to exceed imports. Since 2021, however, the average monthly trade surplus has steadily improved to a level of almost R19 billion.
- Since 2023, the net inflow of foreign funds earmarked for direct investment amounted to R225 billion. The underlying reason for this boost to the financial account of the balance of payments is renewed faith in the potential of the South African economy to deliver growth and attractive returns on investment. No doubt the recent upgrade to the outlook for South Africa’s sovereign bonds by all three major international credit rating agencies has also played its part in attracting foreign investment.
Eskom restructuring welcomed
Progress was made in August with the execution of government’s multi-pronged reform strategy under the Energy Action Plan. South Africa’s president devoted his last weekly newsletter in August to assuring the nation that government was fully committed to creating a competitive wholesale electricity market as part of a strategy to lower the rate at which electricity costs had escalated over the past two decades. Eskom’s century-old monopoly over the electricity sector is on the verge of ending, with private producers and traders about to enter a liberalised electricity market.
According to Business Leadership South Africa (BLSA), the endorsement of the first report of the Eskom Restructuring Task Team (ERTT) by government provided a clear vision for the independent Transmission System Operator (TSO), making the policy unambiguous.
The restructuring of Eskom was preceded by an international donor-funded research project, which concluded that an independent grid operator was necessary to build a competitive electricity market, thereby ensuring lower energy inflation in future, whilst also providing investors with the certainty they need to commit capital to the energy sector.
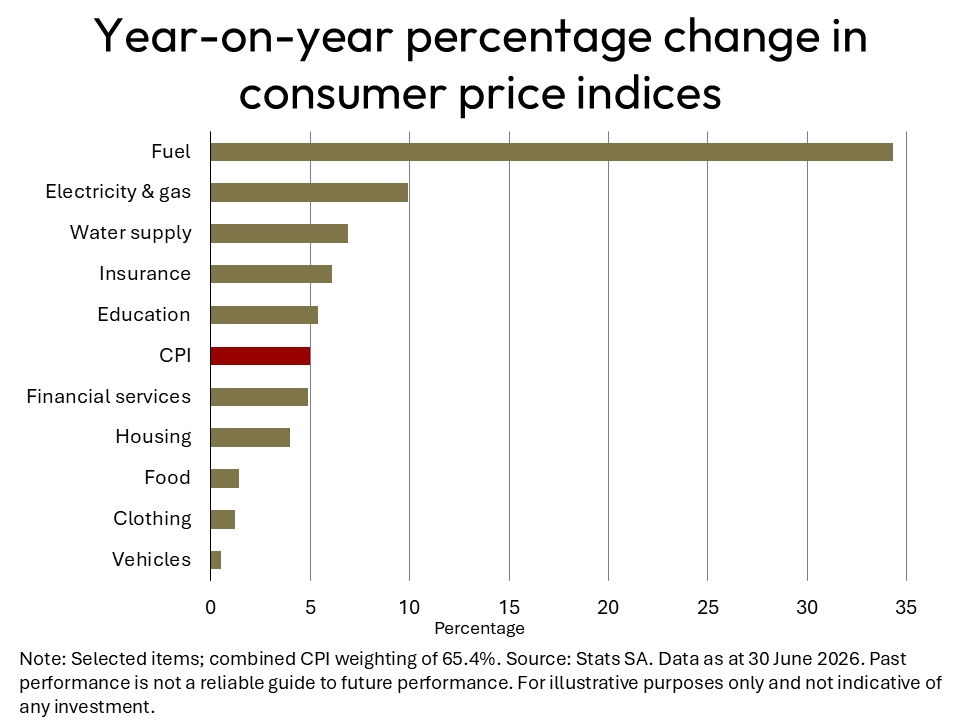
Scrutiny of the composition of key items comprising the consumer price index (CPI) reveals the relentless inflationary impact of electricity costs, which have continued to hover around double-digit rates for several years. Energy experts believe that an overhaul of the electricity pricing policy will help make power more affordable and ease the cost burden on consumers, a view that is shared by South Africa’s Electricity and Energy Minister.
Vehicle sales powering ahead
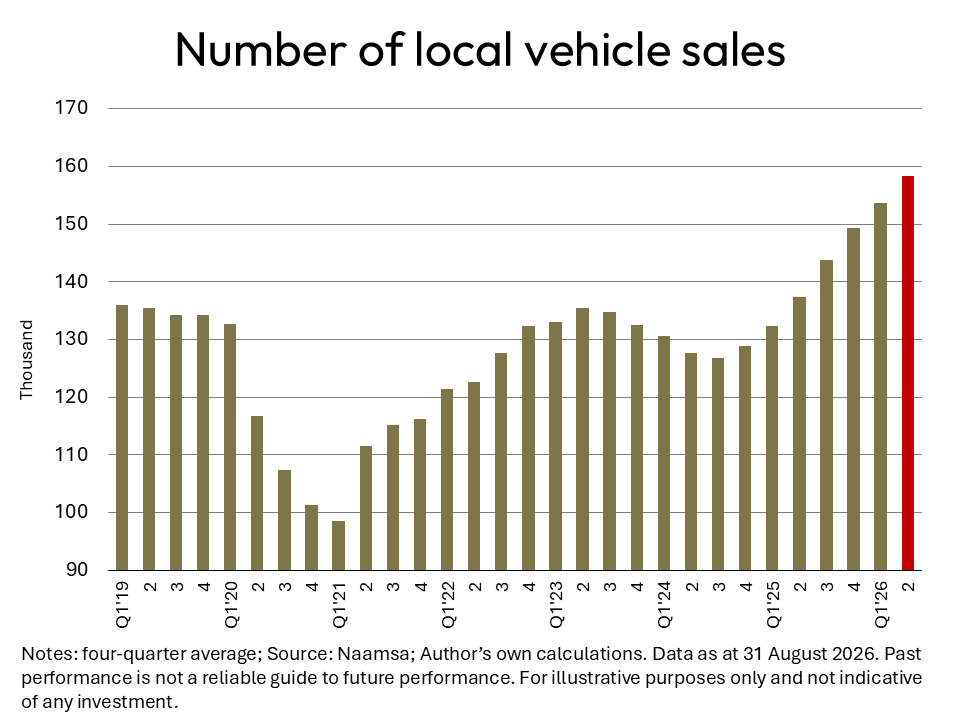
The resilience of the motor vehicle sector since the modest relaxation of monetary policy towards the end of 2024 has been demonstrated by its superior growth performance compared to the GDP. Since then, the latter has only managed an average year-on-year real increase of 1.2%, compared to 7.8% for the value of new vehicle sales.
Although the value of new vehicle sales took a slight dip during the second quarter of 2026, the number of new vehicle sales has continued its upward trajectory to reach an all-time high. It is clear from the figure that the automotive industry took a hefty knock as a result of the lockdowns imposed by the COVID-19 pandemic, but the sector recovered well when the prime rate was lowered to 7%.
Following the oil price shock caused by Russia’s military invasion of Ukraine, the motor vehicle industry suffered another declining trend, due mainly to the interest rate hiking cycle that commenced in November 2021. This saw the prime lending rate climb to a 15-year high of 11.75%. The monetary policy authorities only started lowering rates in September 2024, which eventually led to marginally higher GDP growth and assisted a sound recovery of the motor trade sector.
In addition to the positive impact of the lower cost of credit, the stellar performance of motor vehicle sales has been made possible by an exceptionally strong currency, which has led to an influx of a variety of relatively cheap cars imported from countries in South-East Asia. Against the background of another oil price shock caused by the hostilities in the Middle East and the recent increase in the prime rate from 10.25% to 10.5%, the second quarter’s performance will be a hard act to follow. Hopefully, the war in the Middle East will end soon, which may eventually lead to lower inflation and a resumption of the rate-cutting cycle.
Buyers’ market for homes persists
The latest construction input price index (CIPI) released by Statistics South Africa confirms the continued existence of a buyers’ market in the residential property sector. At mid-year, this barometer of average building costs had increased by 9.5% year-on-year compared to a year-on-year increase of 8.4% in the BetterBond house price index. The latest residential property price index (RPPI) compiled by Stats SA has remained on a lower growth trajectory than the CIPI ever since the prime lending rate (via the repo rate) was increased to its highest level in 15 years.
Although the prime rate has declined by 125 basis points since September 2024, the current divergence between the price of an average house and its average replacement cost suggests that a shortage of available residential properties has been building up.
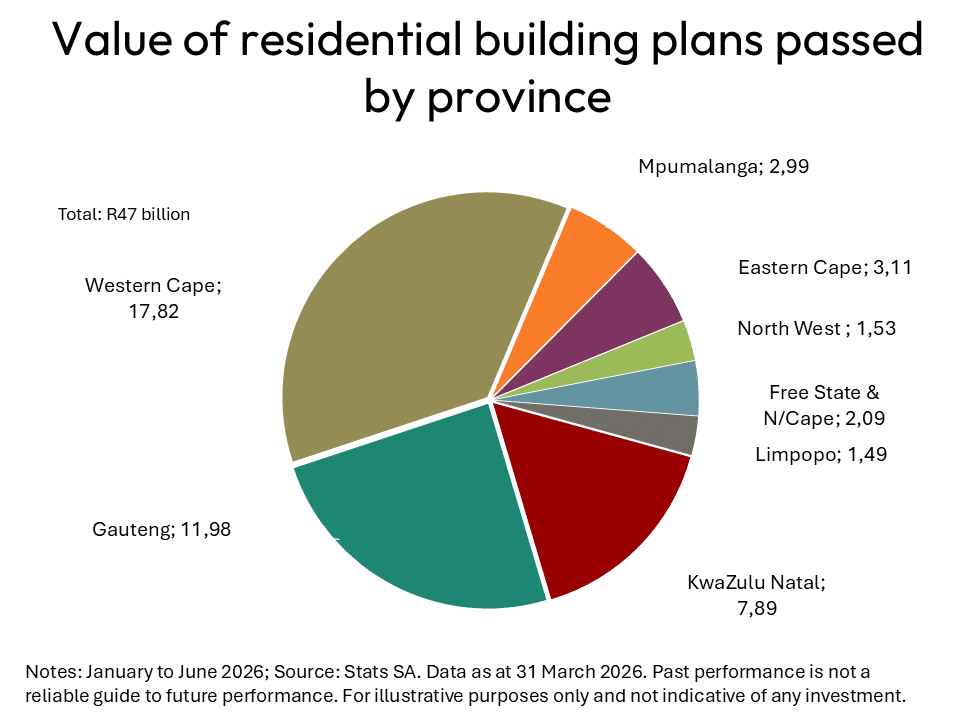
When the value of building plans passed by the metros and the larger municipalities during the first six months of 2026 is compared to the data for ten years earlier, it is clear that residential construction activity is still feeling the negative impact of state capture, the COVID-19 pandemic and the record high interest rates of 2022 and 2023. The value of residential building plans passed between January and June 2026 was R26.2 billion – 10.4% lower than ten years ago at current prices and a whopping 43.4% lower in real terms.
Another observation from the ten-year comparison of data on the values of building plans passed is the sharp declines in the contributions by Gauteng and KwaZulu-Natal, juxtaposed with a significant increase for the Western Cape. Mpumalanga and the Eastern Cape have also recorded increases in these values (at current prices).