Our monthly To the Point column by economist Dr Roelof Botha offers in-depth analysis and commentary on the latest economic trends, market developments, and financial news. Designed to keep you informed and ahead of the curve, each edition delves into key economic indicators, explores their impact on global and local markets, and provides insights to help you navigate the ever-changing economic landscape
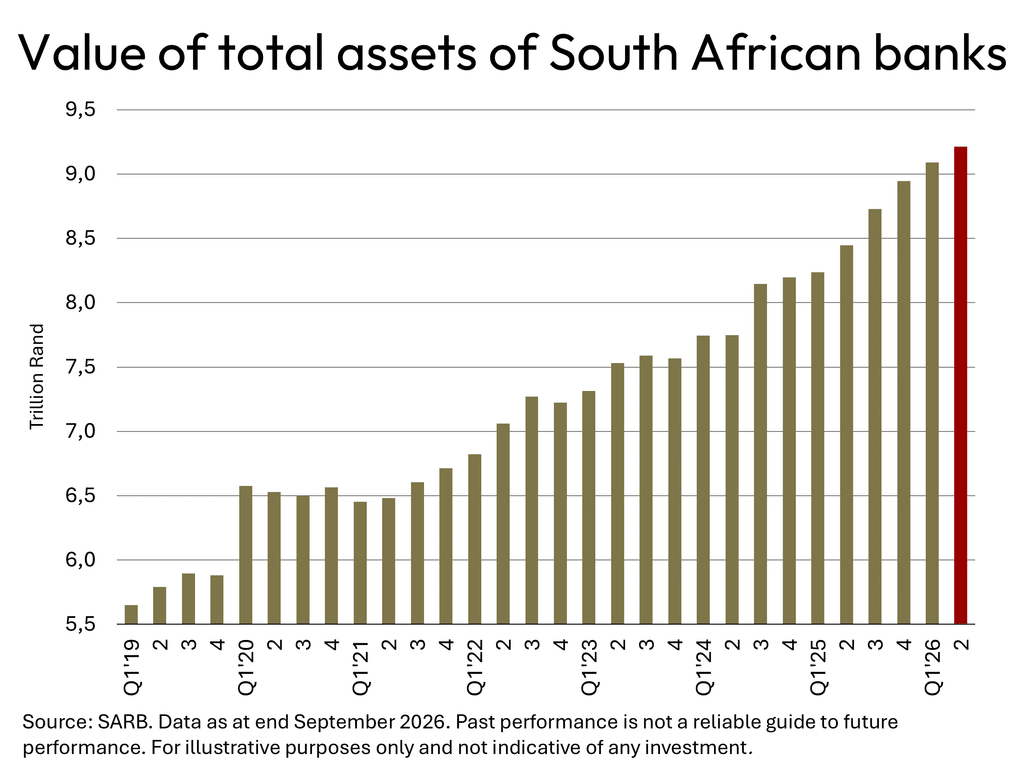
New record for SA bank assets
At the end of the second quarter of 2026, the total assets of South Africa’s banks increased to a new record high of R9.21 trillion – a year-on-year increase of 9.1%. Since 2019, the trend for total bank asset growth has clearly been influenced by seismic events such as the health pandemic of 2020 and the oil price shock that was experienced with Russia’s military invasion of Ukraine.
Both of these resulted in fairly dramatic shifts in monetary policy, but in opposite directions. The brief recession that accompanied the lockdowns of 2020 prompted an accommodating policy stance, with the prime overdraft rate dropping from 10% at the beginning of 2020 to 7% merely six months later.
Unfortunately, the lingering effects of a seven-fold increase in global freight shipping charges in the aftermath of the Covid pandemic, combined with a sharp increase in fuel prices in mid-2022 caused a spike in domestic producer and consumer inflation, which reversed the monetary policy stance.
During the period of restrictive monetary policy, when the prime overdraft rate was increased to a 15-year high of 11.75%, bank asset growth was muted at 2.9%. Since the rate-cutting cycle started toward the end of 2024, bank asset growth has accelerated, increasing by an annual average rate of 8.1%
According to the 2026 PwC Banking Report, lower interest rates and moderating inflation had started to support household affordability, with pockets of improved activity in credit cards, vehicle finance, home loans, payments, and insurance. The report also found that corporate balance sheets remained relatively healthy, while infrastructure needs across all modes assisted in the creation of funding and advisory opportunities for the major banks.
Recovery of construction activity
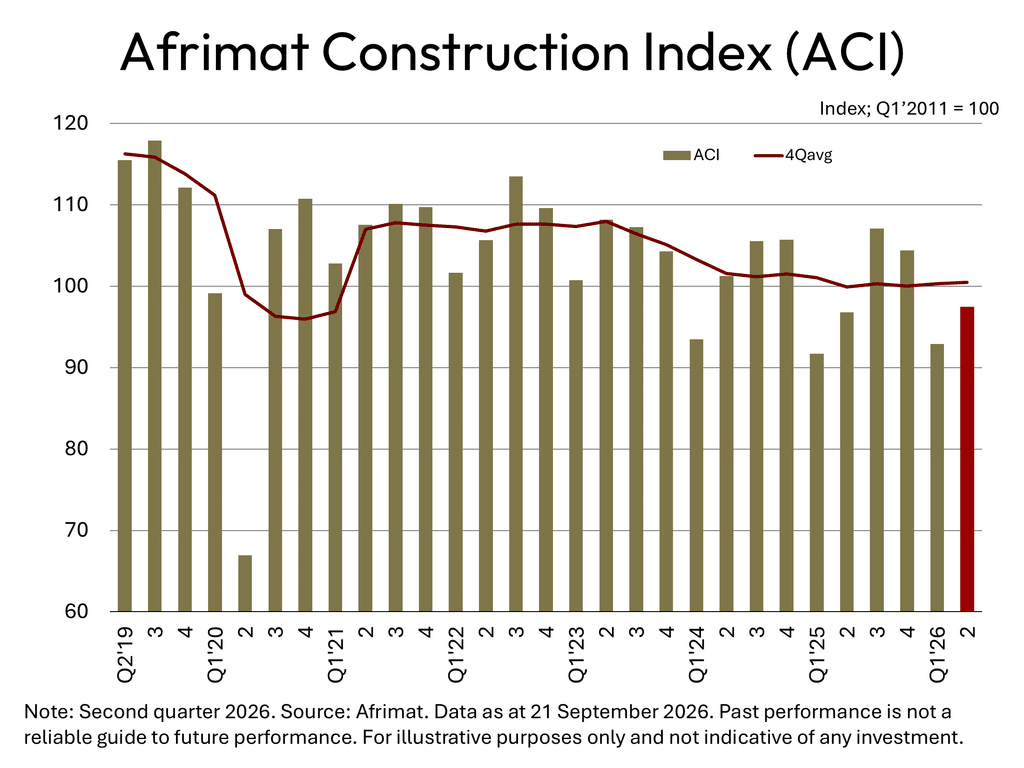
Activity in South Africa’s construction sector picked up nicely during the second quarter of 2026, with the Afrimat Construction Index (ACI) showing an impressive 5% quarter-on-quarter increase in real terms – outperforming the GDP by a considerable margin.
Although the year-on-year increase was more subdued, it is encouraging that employment in the construction sector has increased by 95,000 over the twelve months ended June 2026.
Reasons for the recovery of construction activity are not difficult to find, with the lower cost of capital standing out. The prime lending rate was at a level of 10.25% for most of the second quarter, which represents a decline of more than 12% from the 15-year high that existed until September 2024.
Furthermore, the GDP figures for the second quarter of the year showed encouraging signs of greater participation by the public sector in capital formation, with general government and public corporations recording year-on-year real increases of 7.9% and 17%, respectively for this key macroeconomic indicator.
The Afrimat Construction Index shows consistency in the growth trends for the following indicators, all of which have recorded growth of well above the GDP on both a quarter-on-quarter and a year-on-year basis:
- Wholesale trade sales of construction materials
- Employment in construction
- The value of building plans passed by the larger municipalities
- The volume of building materials produced
Sentiment in agriculture remains positive
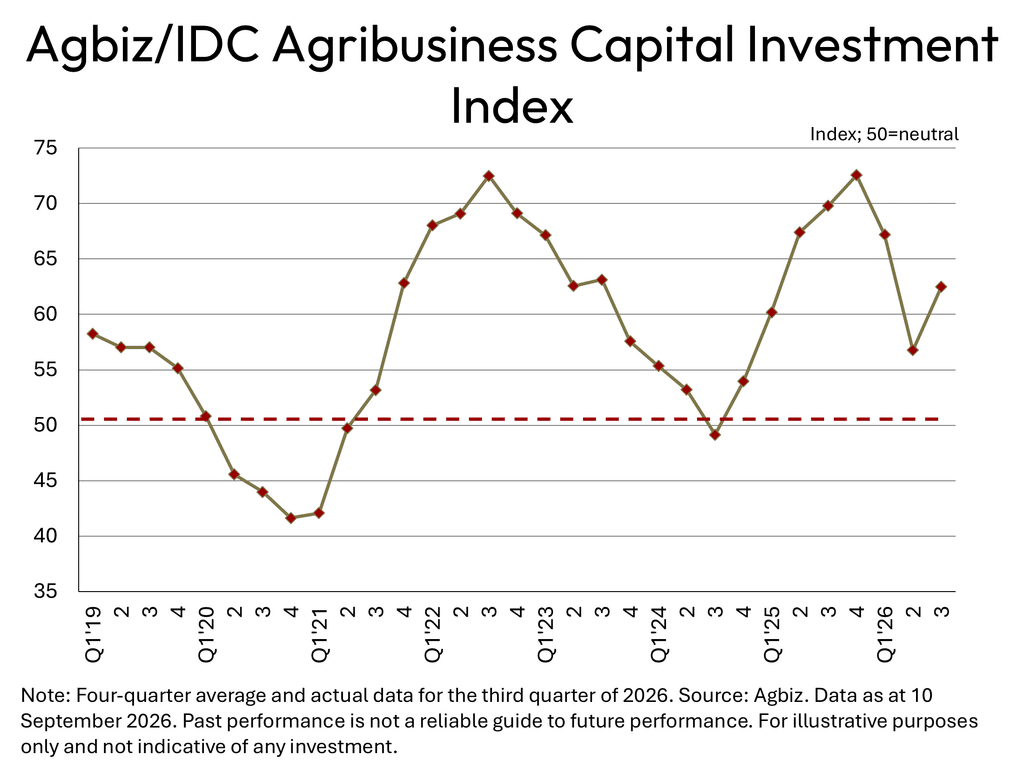
The third quarter reading of the Agribusiness Confidence Index showed a welcome rebound from just below the neutral level of 50 to 53, boosted, inter alia, by a solid recovery of the sub-index for capital formation in agriculture.
This indicator is compiled by the Agricultural Business Chamber of South Africa (Agbiz), in support of the Industrial Development Corporation (IDC) and reflects the perceptions of decision-makers on the ten most important aspects influencing a business in the agricultural sector.
It is clear from the graph that farmers started to consider renewed investment in production facilities and equipment once interest rates started to decline, but the forecasts of a drought later in 2026 contributed to a decline in sentiment during the first half of the year. Uncertainty over higher fuel and fertilizer prices caused by the hostilities in the Middle East also contributed to the recent downward trend, but this was reversed in the latest survey results.
According to Agbiz, optimism in the third quarter was strongest among respondents in grain trading, input suppliers, and the feed industry. Against the background of abundant recent harvests of grain, oilseed, fruits, and vegetables and an exceptionally strong export performance for agriculture and food, this rebound is not surprising.
Although the outlook for agriculture for the rest of the year is clouded by the risks associated with a potential El Niño-induced drought and higher input costs, Agbiz has pointed out that South Africa’s dam levels are in good shape, which will serve to buffer many commercial producers against the effects of below-average rainfall.
Welcome decline in producer price index
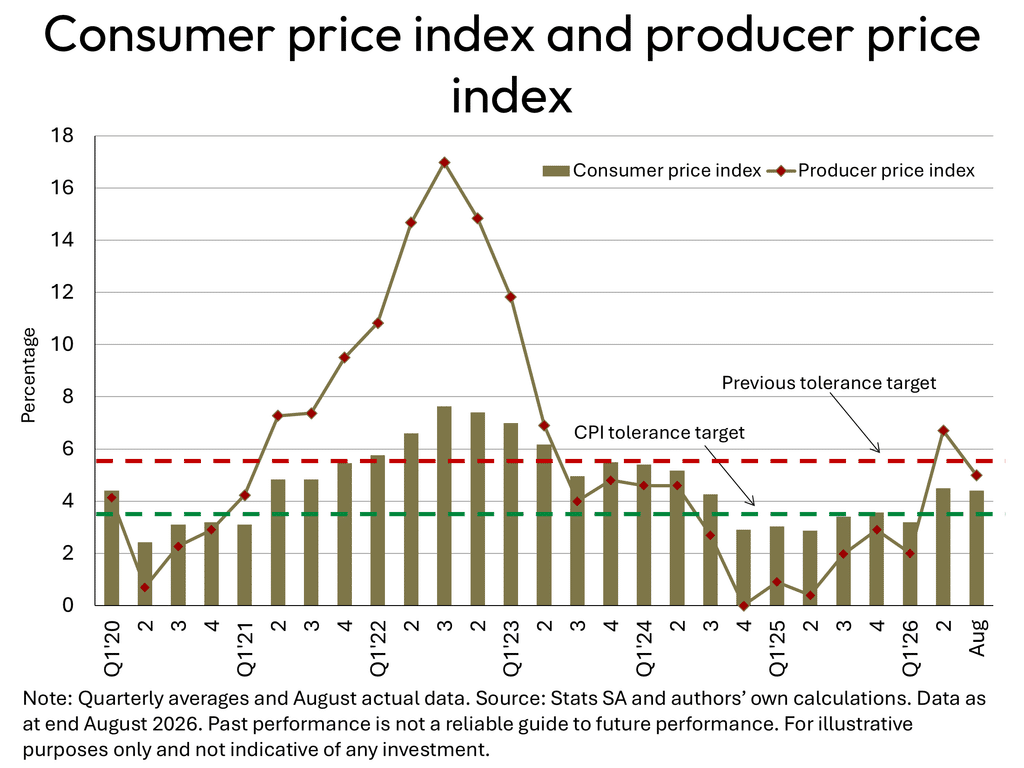
South Africa’s annualised producer price index (PPI), which invariably acts as a leading indicator for consumer inflation trends, has declined from 7.8% in May to 5% in August, driven mainly by negative readings for motor vehicles and the sub-index for agriculture, forestry and fishing.
An interesting observation from the graph is the fact that neither the PPI nor the consumer price index (CPI) are above the top of the previous consumer inflation target range. It is clear that the decision by the Monetary Policy Committee to abandon this target range was never going to stand the test of an oil price shock, as shown by the experience of 2022.
Predictably, petrol and diesel remain the main culprits in the recent rise of the PPI. In August, the annualised price increases for these two products were 20.9% and 31.9%, respectively, whilst high rates of increases for structural metal products and rubber & plastic products have also been observed in the August reading of the PPI. At the opposite end of the producer price equation lies food products, with a year-on-year rate of decline of 0.6% and transport equipment, which experienced a decline of 1.7%. These two product groups account for more than a quarter of the PPI basket.
The key to the PPI trend for the rest of the year lies with the future of the oil price. Once the strait of Hormuz has been fully reopened, global oil and fuel prices are destined to drop to the levels that existed at the beginning of the year, with further downward momentum virtually guaranteed by the imminent combined increase in of around two million barrels of oil production per day from Venezuela and the United Arab Emirates.