Monthly macro and economic insights report
Our monthly To the Point column by economist Dr Roelof Botha offers in-depth analysis and commentary on the latest economic trends, market developments, and financial news. Designed to keep you informed and ahead of the curve, each edition delves into key economic indicators, explores their impact on global and local markets, and provides insights to help you navigate the ever-changing economic landscape
New incentive for exports to China
China’s new zero-tariff policy for 53 African countries took effect on 1 May, providing a significant new incentive for exports of goods to the world’s second-largest economy. South Africa’s farmers and wine producers have been razor-sharp in their preparations for this historic incentive, with the Chinese state media reporting that 24 tonnes of apples and 6,000 bottles of wine from South Africa cleared customs in Shenzhen early on Friday morning, 1 May.
The China-Africa Framework Agreement on Economic Partnership for Shared Prosperity (CAEPA) was established as a framework to promote the common development of China and Africa, through boosting trade and investment and is valid for two years. Significantly, it covers 98% of taxable items (8,786 in total) and includes agricultural products such as fruit, nuts, meat, raisins and wine, as well as virtually all processed and manufactured goods.
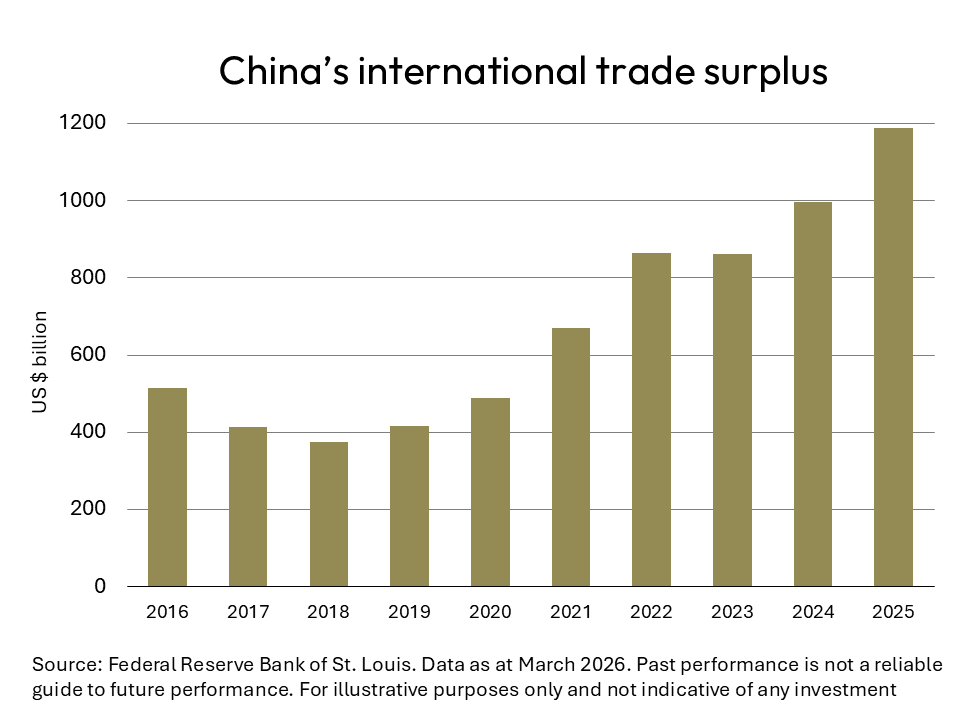
One of the objectives of the new policy approach is to rebalance Africa’s enormous trade deficit with China, moving away from mainly importing raw materials to including manufactured and agricultural products from Africa. The CAEPA has been described as a game-changer and welcomed by all and sundry involved in export activities, most notably the Agriculture Business Chamber (Agbiz). With the Chinese trade surplus having breached the one trillion US dollar mark in 2025, it is clear that the new policy is entirely affordable.
Tourists flock to South Africa
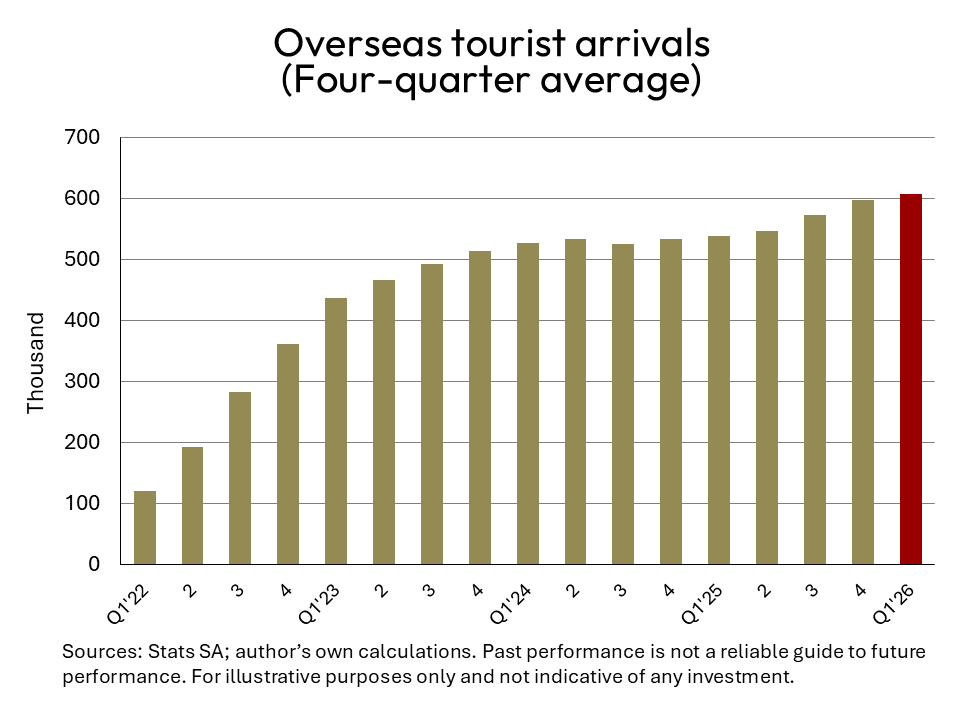
Since the beginning of spring last year in the Southern Hemisphere, tourists from all over the world have been converging on South Africa’s favourite tourist destinations, with Cape Town International Airport consolidating its position as the preferred point of entry. During the first three months of 2026, Cape Town welcomed 332,000 overseas visitors who arrived by air travel, compared to 298,000 that entered South Africa via OR Tambo International Airport.
The Western Cape’s mild and mostly sunny spring and summer climate played its part in a sharp increase of overseas visitors during the five months between August and December 2025, with year-on-year growth of 19%. Although this has tapered off slightly since the beginning of 2026, the year-on-year growth in overseas travellers during the first quarter of the year was 6.3% higher than in 2025 and 10% higher than in 2024 – signalling a complete recovery from the effects of the 2020 health pandemic.
During the first quarter of the year, the UK retained its position as South Africa’s top source country for tourists with 141,000 visitors, with Germany in second place (118,000 visitors) and the US in third spot with 78,000 visitors.
The Netherlands, France and Australia occupy the next three positions, with Canada and Brazil vying neck-and-neck for the number seven and eight places. Switzerland and Russia complete the list for the top ten source countries. Europe remains the mainstay of South Africa’s overseas tourism industry and was responsible for 70% of all overseas tourist arrivals during the first quarter of 2026.
Vehicle sales on the front foot
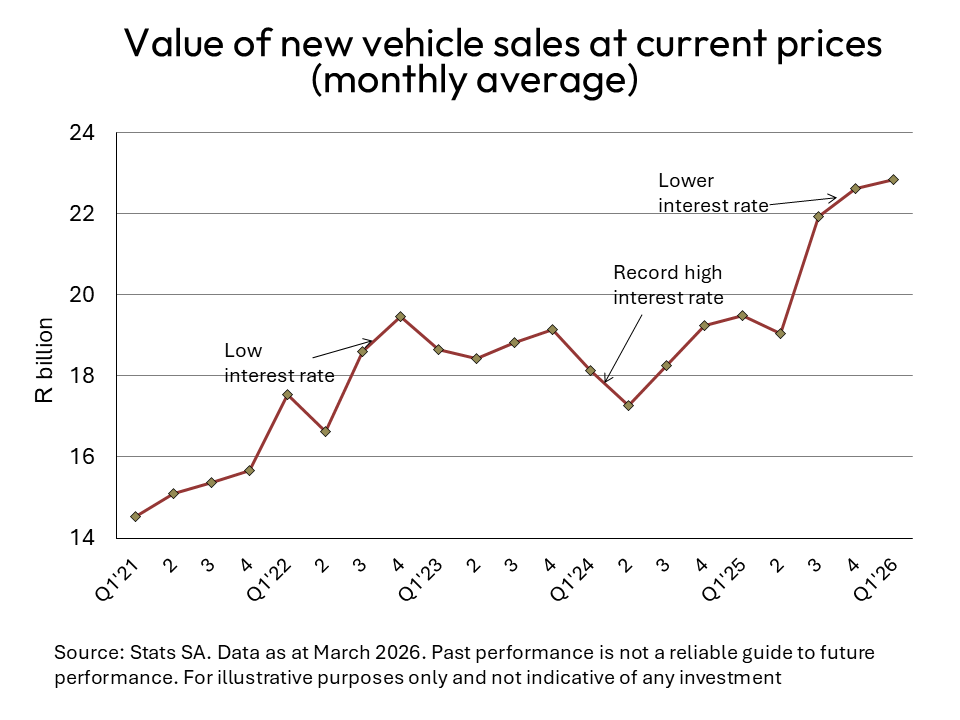
A clear sign of increased economic activity has emerged from both the number and the value of new local vehicle sales during the first quarter of 2026. At R22.8 billion, the average monthly sales of new vehicles have reached a new record high. The number of light commercial vehicles sold during the first quarter of 2026 has also performed exceptionally well, increasing by 13% year-on-year to almost 40,000 units.
Between 2015 and 2020, new vehicle sales numbers remained under pressure, firstly due to the appointment of a new Monetary Policy Committee (MPC), which adopted a restrictive policy stance, resulting in higher real interest rates. Secondly, lacklustre economic growth led to a sharp decline in public sector capital formation and construction activity.
Following the trough experienced during the health pandemic of 2020, a recovery ensued, but it was stopped in its tracks by the highest interest rates in 15 years, which forced GDP growth to below 1%. Fortunately, the lowering of the prime overdraft rate from 11.75% to 10.25% has lifted the motor vehicle sector (and the economy) to a new growth path.
Against the background of higher oil prices and the halting of the rate-cutting cycle, the first quarter’s performance will be a hard act to follow. Hopefully, the war in the Middle East will end soon, which may eventually lead to lower interest rates later in the year.
Western Cape benefits from regional migration
The annual report on intra-provincial relocation published by Wise Move confirms the attraction of the Western Cape relative to other provinces, with KwaZulu/Natal remaining fairly stable and the Eastern Cape showing a modest net gain from inward migration. When analysing the number of moves in and out of the three provinces with the largest metros and relating these data to the average number of households, the Western Cape recorded a net gain of almost 2,000 households during 2025, whilst Gauteng lost more than 3,600 households.
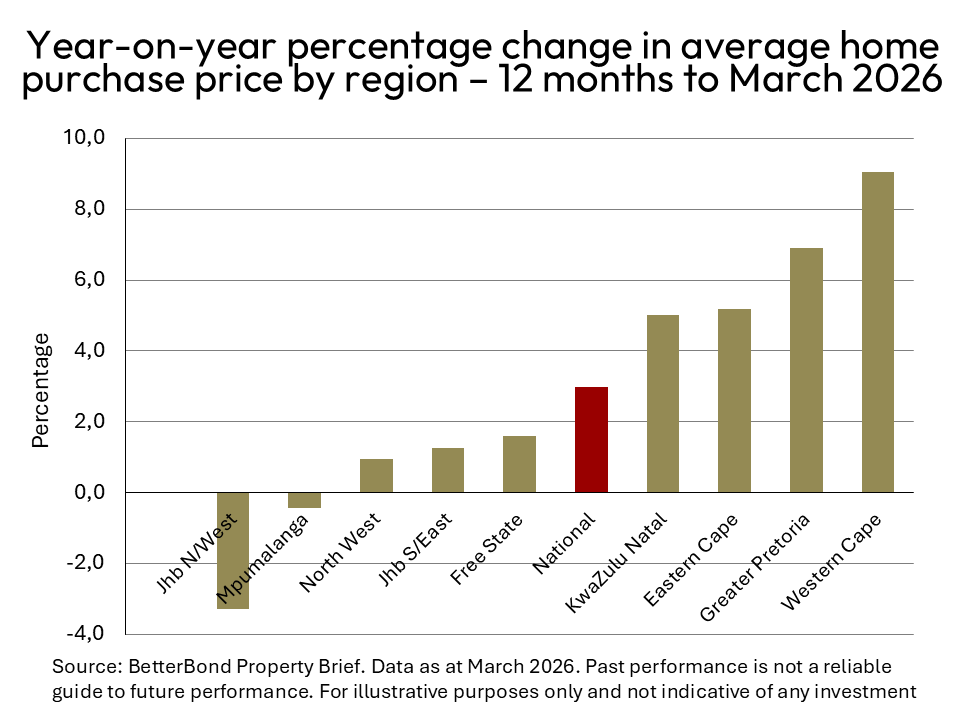
This data set correlates largely to information on average house prices for selected regions compiled by BetterBond. During the 12 months ended 31 March 2026, the average house price in the Western Cape increased by 9%, followed by the Greater Pretoria region at 6.9% and the Eastern Cape at 5.2%. Together with KwaZulu/Natal, these were the only four regions that recorded increases in residential property prices above the rate of inflation.
When adjusted for the consumer price index, average house prices during the 12 months ended March 2026 have declined by 6.3% in Johannesburg’s North-Western suburbs and by 1.7% in Johannesburg’s South-Eastern suburbs (for mortgage loans administered by BetterBond). The Western Cape remains way out in front, with an average price of R2.3 million for the 12 months to March 2026, followed by Greater Pretoria at R1.76 million, compared to a national average of R1.62 million.
According to data from Statistics SA, the value of approved building plans for houses and flats has stabilised in the Western Cape and in KwaZulu/Natal, mainly due to lower interest rates during last year. Unfortunately for Gauteng, however, this indicator has remained on a downward trend, having declined by 31% over the past two years.