


“Correction”, “bear market”, “crash” and “crisis” get used interchangeably in the media. For a client, they describe very different experiences. A 10% fall is uncomfortable. A 20% fall is frightening. A 30% fall can feel catastrophic.
When the JSE falls sharply, the phone calls start. Clients ask whether this is “the big one”, whether they should switch to cash, and whether you saw it coming. How you frame the decline in that first conversation often shapes what the client does next.
Magnitude, speed and duration
There is no universally accepted definition of a market crash. The industry generally uses the following conventions:
| Decline from recent high | Common label | Typical character |
| Around 5 -10% | Pullback | Normal market volatility |
| 10%+ | Correction | A meaningful decline, often a repricing of valuations |
| 20%+ | Bear market | A prolonged or substantial decline |
| 30 – 50%+, especially over a short period | Crash or severe bear market | Extreme selling, usually tied to a major shock |
The percentage alone does not tell the whole story. A 20% decline spread over two years is a very different client experience from a 20% decline in three weeks. A 30% fall can also recover quickly, while a smaller one can grind on for years.
A more useful framework is to think in three dimensions: magnitude, speed and duration. A 15% fall over several months may be a routine correction. The same 15% over several days feels like a crash. A 60% fall over several years is something else altogether. This is why understanding drawdown is one of the most valuable lessons clients can learn. It measures the decline from a previous peak to the subsequent low. Crucially, it also lets us ask the question most commentary ignores: how long did it take to recover?
A century of South African drawdowns
Long-term JSE equity return series go back as far as 1925, giving us a century of evidence through wars, depressions, political upheaval, commodity cycles and financial crises. This historical insight is one of the most useful tools we have for encouraging investors to remain invested when it matters most.
History’s message is an optimistic one: every crash in the JSE’s history has eventually given way to new highs, and investors who stayed the course have been rewarded.
As can be seen in the graph and table below, large declines are not rare events on the JSE. They have happened repeatedly, and yet South Africa has been the best-performing stock market in the world since 1900, with an annualised real return of about 7% (according to the UBS Global Investment Returns Yearbook 2026). That return was earned through the declines below, not around them.
Exhibit 1 | Decline from prior peak percentage – illustrative
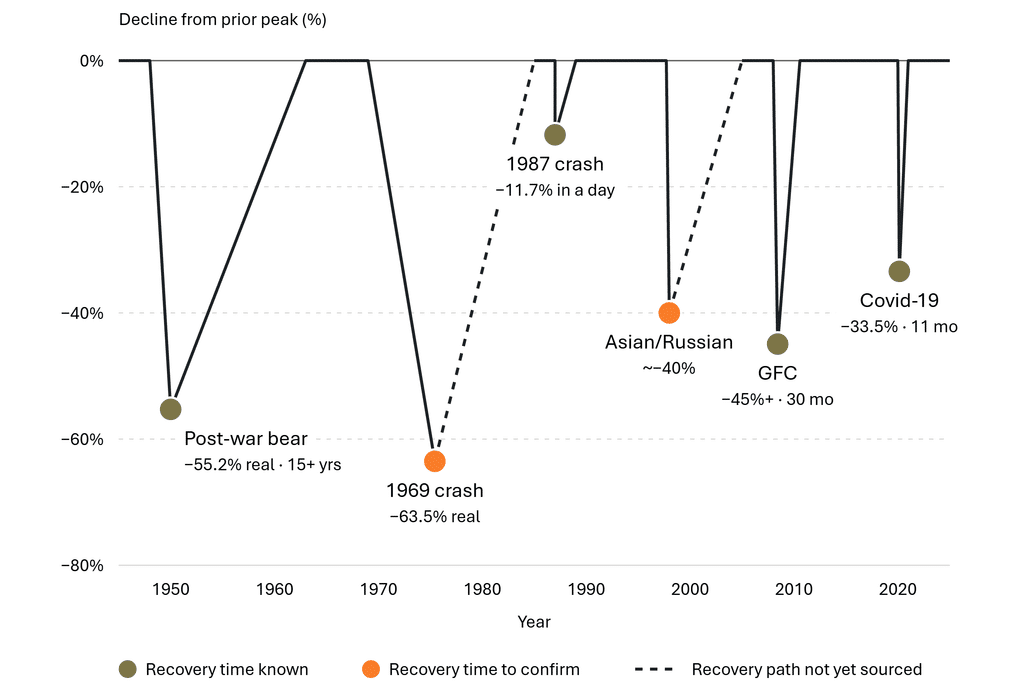
Note: For illustrative purposes only. Illustration shows the approximate decline of the FTSE/JSE All Share Index (ALSI) from its prior peak during each episode, not actual index levels. Declines for the post-war bear market (from 1948) and the 1969 crash are in real (inflation-adjusted) terms; all other episodes are in nominal price terms, so depths are not directly comparable. Trough timings are approximate. Dashed segments following the 1969 and 1998 episodes are placeholders only, as recovery periods for these events have not yet been confirmed. Past performance is not a reliable indicator of future results.
| Episode | Decline | Gain needed to regain the peak | Time to recover | What stands out |
| Covid-19 shock (2020) | About 33.5% at the 19 March low | About 50.4% | About 11 months: the ALSI ended 2020 above its 17 January high | ALSI still ended 2020 about 4.1% higher on a price basis |
| Global financial crisis (2008) | More than 45%, May to November | More than 81.8% | About 30 months: pre-crash level regained on 4 November 2010 | Fast, deep and global in origin |
| Asian/Russian crisis (1998) | Roughly 40% from peak by October | About 66.7% | To confirm | Felt structural at the time; proved temporary |
| 1987 crash | About 11.7% on 20 October alone | At least 13.3% (the one-day fall alone) | 14–26 months: the 19 October 1987 close of 2,804 was regained during 1989 | Dramatic in a day, relatively short-lived overall |
| 1969 crash | About 63.5% in real terms | About 174% in real terms | To confirm | The deepest real drawdown on record; about 2½ years to the trough |
| Post-war bear market (from 1948) | About 55.2% in real terms | About 123% in real terms | More than 180 months in real terms | More than 15 years to recover in real terms |
Two patterns are worth highlighting for clients.
First, the modern crises most clients remember (years 1987, 1998, 2008 and 2020) were short and sharp compared with the long bear markets earlier in South African history. They felt permanent while they were happening, but they were not.
Second, 2020 shows how much the timing of the observation matters. A client who opened their statement in late March 2020 saw a crisis. A client who looked at the full calendar year saw a positive return. Both were right; they were simply looking at different points in time.
Exhibit 2 | The ALSI through its setbacks, 1975 to 2023
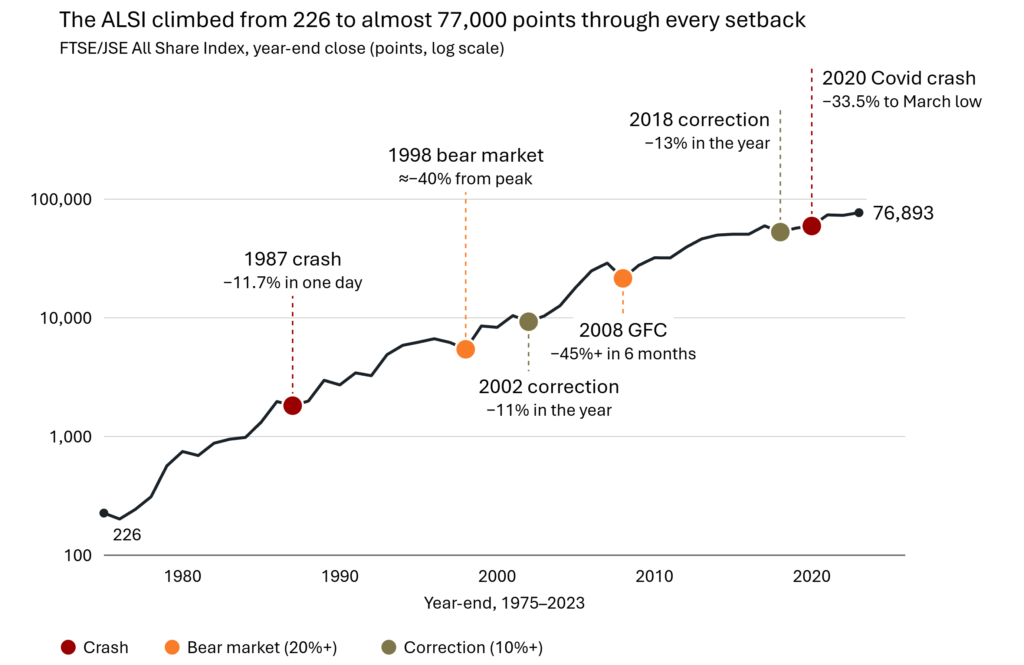
Source: Year-end ALSI closes 1975 – 2023 from Wikipedia’s FTSE/JSE All-Share Index page; event declines from the article. Price index only; excludes dividends. Past performance is not a reliable indicator of future results
The chart above uses year-end closes, which smooth out intra-year falls. 1987 ended only 7.7% down despite its one-day crash, and 2020 ended 4.1% up despite a 33.5% fall to the March low. The log scale shows each percentage move at the same height, whether the index was at 200 or 70,000.
Depth versus duration: Where the real risk lies
The biggest risk to a client is not temporary volatility, but rather the combination of a large loss and a long recovery period.
The 1948 episode highlights this point. An investor who bought at that peak lost more than half their value in real terms and waited more than 15 years to get back to where they started (after inflation). That is not a correction; it is a lost decade and a half, and for a retiree drawing income, it would have been devastating.
By contrast, the 1987 crash produced one of the most dramatic single-day falls in JSE history, yet its longer-term impact was comparatively brief. Depth and duration are different risks, and the size of a decline tells us very little about how long recovery will take.
For advisors, this has a practical implication. When a client asks, “how bad can it get?”, the honest answer includes both dimensions: how far markets have fallen, and how long some investors have had to wait.
The maths of recovery and sequence risk
Losses and gains are asymmetric, and the gap widens quickly as declines deepen. A client with R1 million who experienced the 2008 drawdown of about 45% would have seen their portfolio fall to roughly R550,000. Getting back to R1 million required a gain of about 81.8%, not 45%.
| Portfolio loss | Gain required to recover |
| – 10% | + 11.1% |
| – 20% | + 25.0% |
| – 30% | + 42.9% |
| – 40% | + 66.7% |
| – 45% | + 81.8% |
| – 50% | + 100% |
| – 60% | + 150% |
This is why market declines should not be dismissed as “noise”. A large drawdown can materially change the time needed to reach a financial objective. Every decline should also not spark immediate panic.
The true impact depends heavily on where the client is in their life cycle:
- Accumulators making regular contributions (for example to a retirement annuity) buy more units at lower prices during a decline. A correction is uncomfortable, but it can work in their favour.
- Decumulators drawing an income (such as retirees) may be forced to sell units after prices have fallen. That crystallises losses and leaves less capital to participate in the recovery. This is sequence-of-returns risk, and it is where drawdowns do the most lasting damage.
Clients approaching or in retirement therefore need a different conversation, and often a different portfolio structure, from younger clients who are still contributing.
The JSE is not the South African economy
Clients often assume that a falling JSE reflects a dwindling economy and that a weak rand value means a weak South Africa. This is rarely the case. Many of the largest JSE-listed companies earn a substantial share of their revenue and profits offshore, meaning their performance doesn’t correlate with the South African economy.
As a result, the market responds to global growth, commodity prices, developments in China, developed-market interest rates, global risk appetite and the rand. Research on JSE performance between 2010 and 2022 found that global factors (particularly those involving the US and China) had a significant influence. The market impact of domestic events was more limited and shorter-lived.
This matters in client conversations. A client who reads every JSE decline as a verdict on South Africa is more likely to make an emotional, politically driven decision, such as abandoning local equities entirely. Explaining what actually drives the index helps separate the headlines from the portfolio.
How skilled equity managers turn sell-offs into opportunity
For a disciplined equity manager, a correction or crash is often the best hunting ground of the cycle. When fear takes over, prices move far more than the underlying businesses do, and that gap is where long-term returns are made.
Sell-offs create opportunity because the selling is rarely selective. Investors facing margin calls, redemptions, or panic-sell what they can, not what they should. Index and passive flows sell every share in proportion. The result is that high-quality companies with strong balance sheets and resilient earnings are often marked down alongside genuinely vulnerable ones.
Good managers use these moments in a few recognisable ways:
- They buy quality at a discount – A crash can offer the chance to own a company the manager has long admired at a price that was unthinkable a few months earlier.
- They separate price from value – Rigorous valuation work lets a manager tell the difference between a share that is cheap because the business is impaired and one that is cheap because the market is frightened.
- They look through the headlines – Because much of the JSE earns its profits offshore, a sell-off driven by local sentiment can leave globally diversified businesses mispriced. The reverse also happens, with domestically focused shares sold off on global fears.
- They keep dry powder and rebalance – Managers who hold some liquidity, or who rebalance into weakness, can add to their best ideas while others are forced to sell.
- They stay patient – The rewards of buying in a crisis usually arrive over the following years, not weeks.
The 2020 COVID crash shows how quickly this discipline can pay off. In the 12 months to the end of March 2021, measured from the depths of the sell-off, the ALSI rose by about 54%. Managers who used the panic to add to quality businesses were well rewarded for their conviction.
This is also where manager selection earns its place in the advice process. Skill in navigating crises varies widely, and not every active manager adds value. The managers worth backing tend to have a clear, repeatable process, a strong valuation discipline and a track record that spans more than one full market cycle. For clients, knowing that their portfolio is in the hands of a manager who treats a sell-off as an opportunity can make it far easier to stay invested when markets fall.
Using history in client conversations
Clients do not experience markets in decades; they experience them day by day. A 10% fall looks far larger on a statement than on a 100-year chart. They also tend to generalise and assume that when markets rise, they should expect more gains, and when markets fall, expect more losses. Both instincts can be costly.
The questions change as a decline deepens. At 10%, clients ask, “Is this the start of a crash?” At 20%, they ask, “How much further can it fall?” At 30%, they ask, “Will it ever recover?” History gives a credible answer to each, provided we use it honestly.
A few principles help:
- Don’t promise quick recoveries: 1948 and 1969 show that some recoveries took years. Credibility built on honesty lasts longer than reassurance.
- Don’t treat every fall as a reason to buy the whole market: A market can stay expensive after a 10% fall, and fall another 20% after falling 20%. History cannot tell us where the bottom is, which is why careful stock selection matters more than calling the market.
- Separate depth from duration: Explain that the size of a decline and the time to recover are different risks, and show where the client’s plan addresses each.
- Reframe the question: Move the conversation from “what will the market do next?” to “can my plan withstand this without forcing me to sell at the worst time?”
- Prepare clients before the fall: The best time to show a client the drawdown table is at the review meeting when markets are calm, not on the phone during a sell-off.
Surviving a drawdown is a portfolio-construction problem, not a market-prediction problem. Since nobody can reliably time the next correction or crash, the plan must be built to withstand one.
The long view
Equity investing in South Africa has never been a smooth journey. The JSE has been through depressions, wars, political upheaval, currency crises, financial crises and a pandemic. Some investors lost more than half their real wealth, and some waited more than a decade to recover. Yet every time, the market recovered and went on to set new highs.
Those episodes sit inside a much longer record of earnings growth, dividends and compounding. In July 2025, the JSE announced that the All-Share Index had crossed 100,000 points, up from a base of 100 in January 1960, an annualised return of more than 11% over 65 years.
The longest view is the most encouraging of all. The 2026 Yearbook by Dimson, Marsh and Staunton found that South Africa delivered the highest annualised real return of any country with an uninterrupted market history since 1900: about 7% a year, ahead of the United States and Australia. That record was achieved through wars, the Great Depression, political upheaval and policy uncertainty. Several markets that might have rivalled it suffered breaks instead, when they were closed, nationalised or wiped out by war or revolution. The JSE kept trading throughout. For South African clients, that is a powerful argument to remain invested.
The value of financial advice
The adviser’s job is not to help clients avoid every correction or crash. It is to make sure their portfolio, their financial plan and their behaviour are robust enough to survive them.
Corrections are the price of admission to equity investing. Crashes are the extreme version of that price. Compounding is the potential reward for staying invested through both.
__________________________________
Source(s) and data notes:
- The longest South African equity data referenced here begins in 1925, using historical FTSE/JSE All Share equity-return series. The JSE’s modern ALSI series is calculated back to 1960, with historical monthly data extending further back. Figures for 1948 and 1969 are real (inflation-adjusted) drawdowns; figures for 1987, 1998, 2008 and 2020 are nominal index declines.
- The distinction between price, total and real returns matters. An index’s price level excludes dividends, while long-term investor wealth depends heavily on dividends and their reinvestment.
- Figures are drawn from the UBS Global Investment Returns Yearbook 2026, long-term South African investment-return research, JSE announcements and contemporary market commentary. They should be checked against primary sources before publication.
- Past performance is not a reliable indicator of future returns. This article is for information purposes and does not constitute financial advice as defined in the Financial Advisory and Intermediary Services Act (FAIS).

