


After years of trading at a discount to global peers, the JSE is showing signs of renewed potential. Improving credit fundamentals, strong commodity prices and lower valuations create a compelling case to reconsider South African equities within a diversified portfolio.
South African equities trade at roughly 8.5x forward earnings against 19.1x for the S&P 500, a discount of about 55%. Sovereign upgrades, the greylist exit, and record gold prices have improved fundamentals, while the JSE’s 7% pullback over the past month offers a better entry point. This creates an opportunity to invest in quality South African companies at more attractive valuations, with potential for improved returns if investor sentiment and earnings prospects strengthen. By contrast, the US is priced for strong AI-driven earnings and is more concentrated than at almost any point in its history.
Valuation gap: South Africa trades at a significant discount
South African equities trade at a substantial discount to both emerging-market peers and the US market. This relative valuation gap has persisted for several years, suggesting that South African equities remain attractively priced relative to global alternatives.
The JSE trades at roughly half the valuation of the US market. On every common valuation measure, South African equities are priced at about half the level of US equities, as can be seen below:
| Measure (end-September 2026) | South Africa | United States |
| Forward P/E | 8.5x | 19.1x |
| Trailing P/E | 12.1x | 26.0x |
| CAPE (10-year cyclically adjusted) | 18.1x | 35.9x |
Data as at 30 September 2026. Past performance is not indicative of future performance. For illustrative purposes only and not indicative of any investment. SA’s forward P/E traded at 15-17x before 2017, so today’s level is well below its own history (LSEG FTSE Russell). The US forward P/E sits on its 10-year average of 19.1x only because CY2026 earnings are expected to grow 32.7% (FactSet). Other figures: Siblis Research.
The discount is not only relative to the US. SA’s forward P/E traded at 15 – 17x before 2017, so today’s 8.5x sits well below its own history. The US looks fair on its 10-year average forward P/E of 19.1x, but only because calendar year (CY) 2026 earnings are expected to grow 32.7%. If that growth disappoints, the US multiple rises quickly.
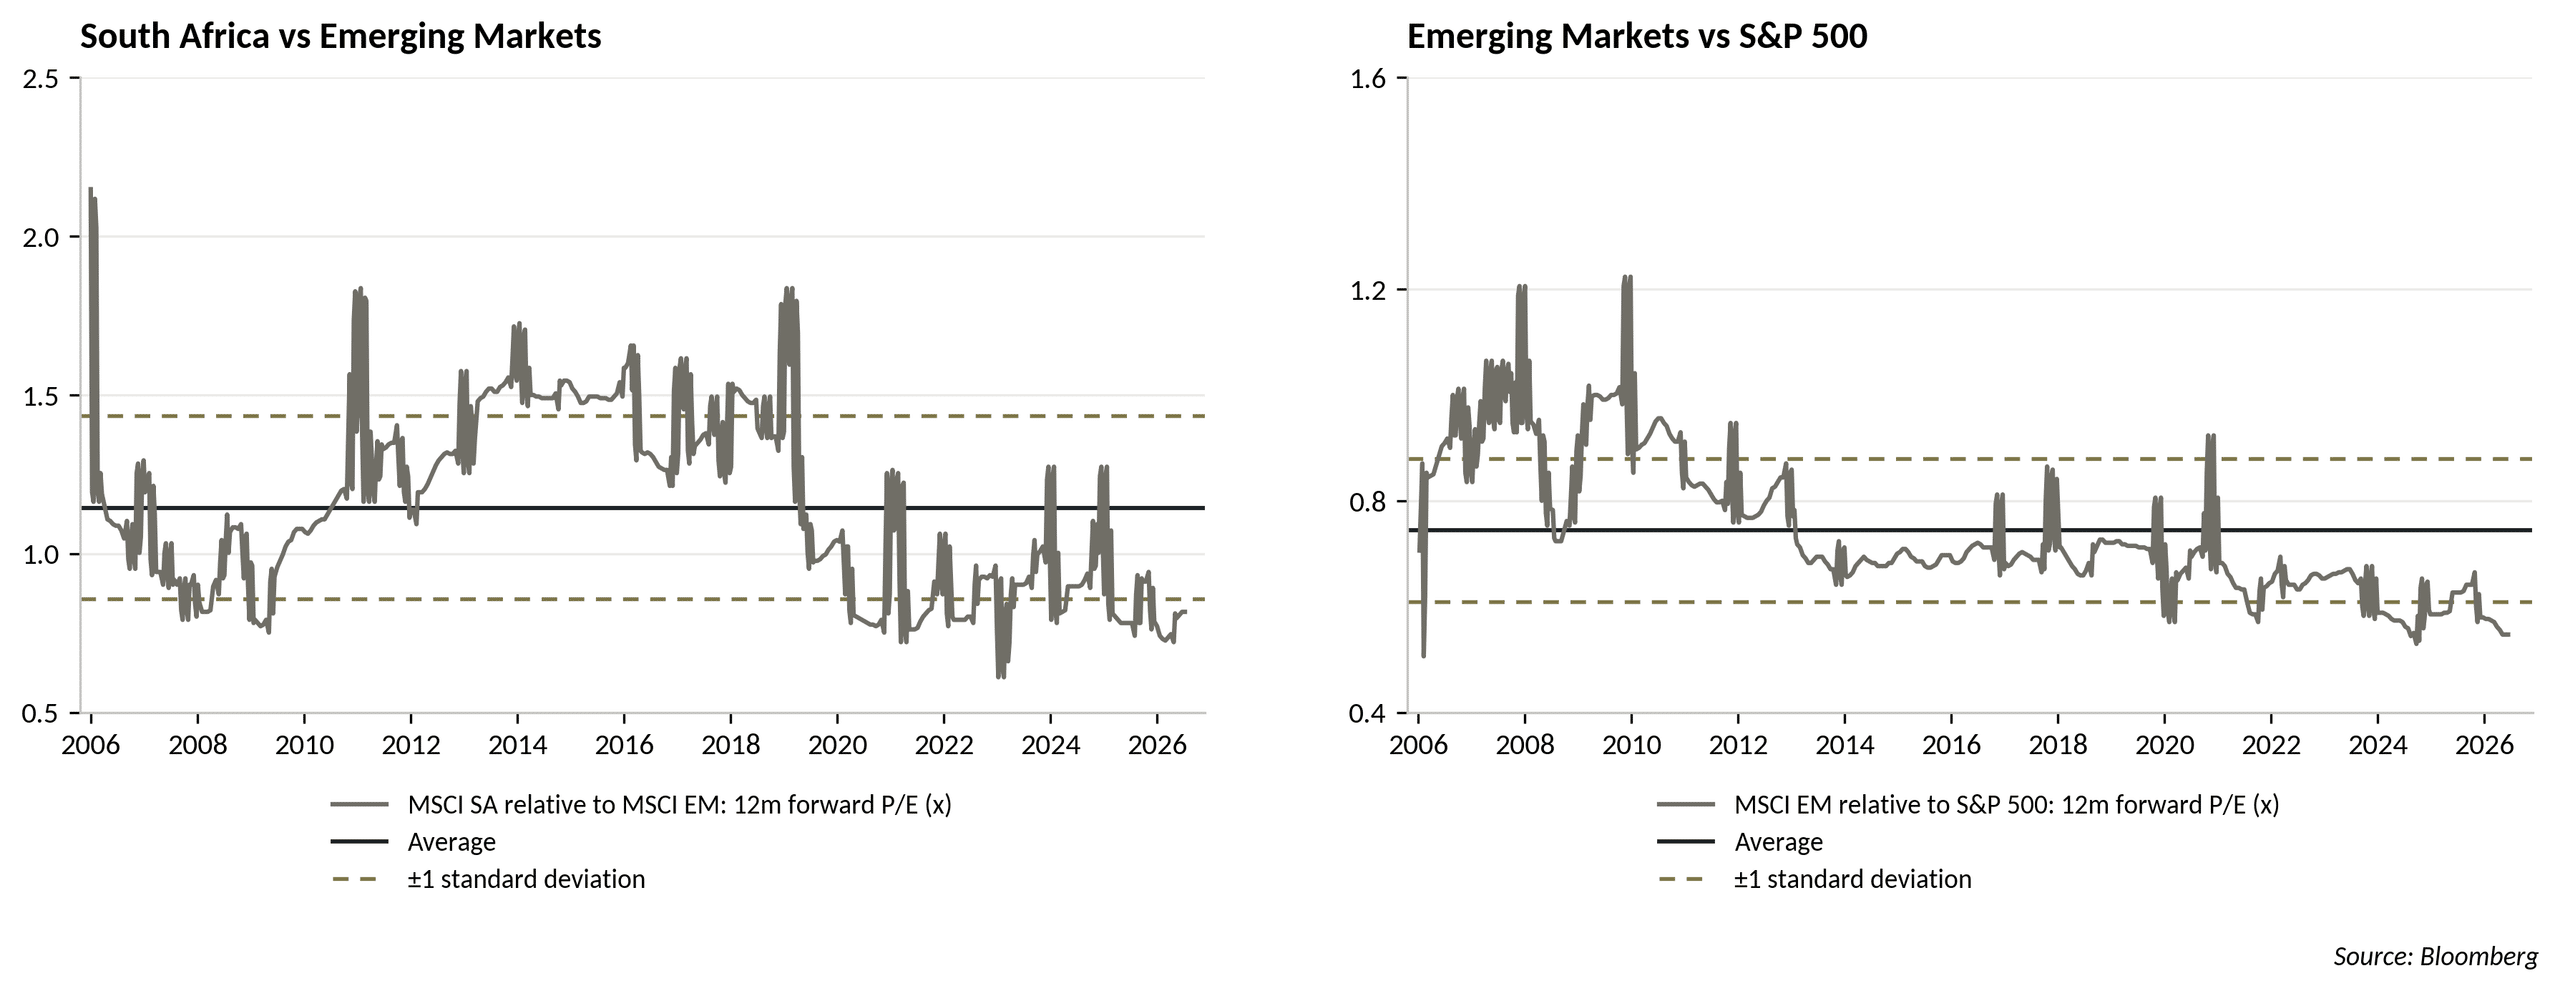
The two charts below compare how expensive one market is against another, using the relative forward P/E.
In the left chart: South Africa versus Emerging Markets (EM). S.A. used to trade at a premium to other EM’s. From about 2011 to 2019, it was usually 1.3 to 1.6 times the EM multiple. Around 2019 – 2020, that premium collapsed. S.A. now trades at about 0.8x the EM multiple, below both its average of about 1.14 and the bottom of its normal range. In other words, S.A. has gone from one of the more expensive EM markets to one of the cheaper ones.
In the right chart: EM versus the S&P 500. Before 2010, EM traded close to the US multiple, at around 0.9 to 1.2x. Since then, the ratio has drifted steadily lower. It now sits at about 0.55, below its average of about 0.74, below its normal range, and at the lowest point on the chart.
Read together, the two charts show a double discount.
Exhibit 1 | S.A. is cheap relative to EM, and EM is cheap relative to the US
Source: Investec and Bloomberg. Data as at 30 September 2026. Past performance is not indicative of future performance. For illustrative purposes only and not indicative of any investment.
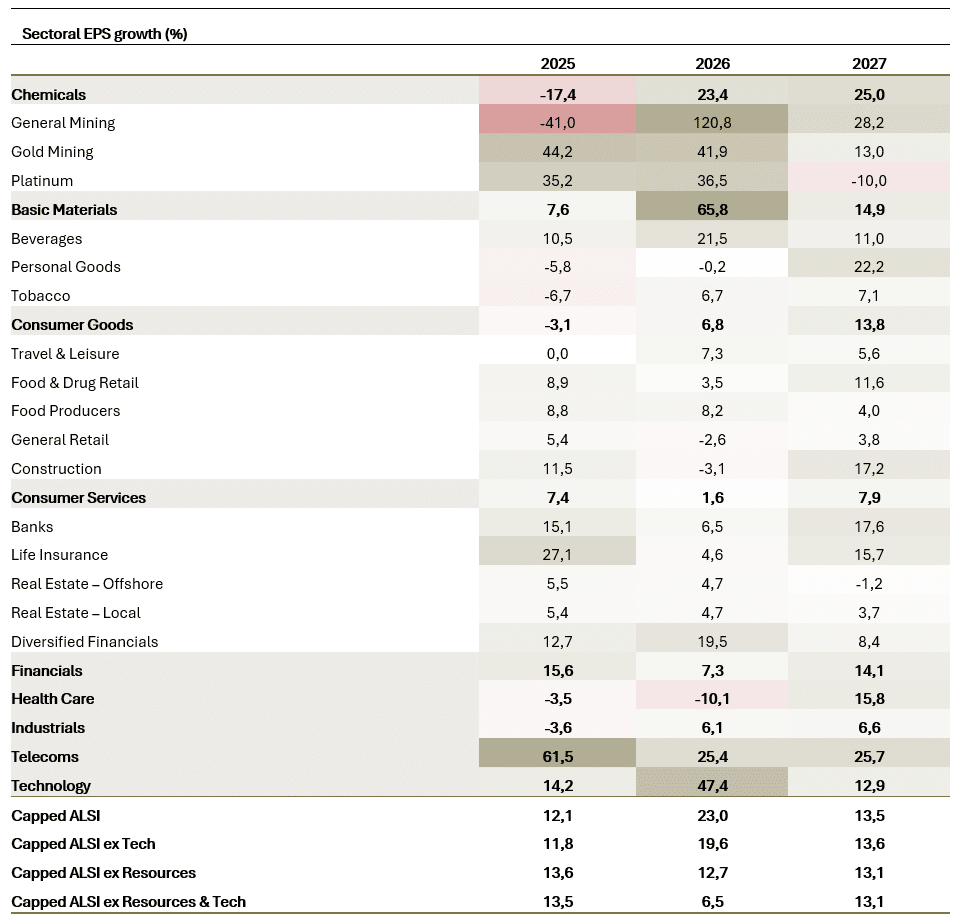
The table below shows that South Africa’s strong headline earnings growth for 2026 is narrow and only broadens in 2027.
Exhibit 2 | Earnings per share (EPS) Growth percentage by sector
Source: Investec and Bloomberg. Data as at 30 September 2026. Past performance is not indicative of future performance. For illustrative purposes only and not indicative of any investment.
Why now: South Africa’s turning points
Several catalysts are lining up to narrow South Africa’s valuation discount. On the credit side, S&P upgraded SA to BB with a positive outlook in November 2025, and Fitch followed with an upgrade to BB in June 2026. These moves put investment grade back on the horizon, and each further step would lower the country’s cost of capital and attract index-tracking foreign flows. The Financial Action Task Force’s (FATF) removal of S.A. from its grey list in October 2025 has also cut compliance costs for foreign investors and removed a long-standing barrier to inflows. Commodities add a cyclical tailwind as gold neared $4,460/oz, the JSE’s miners are generating windfall earnings, and S.A.’s terms of trade have improved.
Monetary policy is now a source of stability as well. The South African Reserve Bank (SARB) targets 3% inflation and expects CPI, at 4.4% today, to return there by late 2027. Its September hike to 7.25% shows it is prepared to act to get there, which should support the rand over time.
Finally, the entry point is attractive, and the All Share is near 108,300, about 7% below its recent peak and -1.5% down for the year. Investors can therefore buy into these improving fundamentals at a lower price than earlier in the year.
Why the US looks stretched
The US market’s strength has become concentrated in a small number of companies. The ten largest stocks now make up about 38% of the S&P 500, up from 23% in 2019, and Nvidia alone accounts for 7.5%. As a result, the index behaves like a portfolio of only about 47 equally weighted stocks rather than 500, so investors who think they own a broad market are making a much narrower bet.
Valuations leave little room for disappointment. A cyclically adjusted price-to-earnings ratio (CAPE) of 36x assumes that the heavy spending on AI will earn an adequate return and that earnings will keep growing strongly after the 32.7% expected for CY2026, with consensus already looking for another 15.8% in 2027. If either assumption fails, there is little valuation cushion to absorb the shock. The JSE offers a genuine alternative. Its mix of miners, banks, Naspers/Prosus and rand-hedge industrials overlaps little with US mega-cap tech, so it diversifies a global portfolio rather than repeating the same exposure.
Risks to the thesis
The domestic economy is weak. Gross Domestic Product (GDP) contracted in the second quarter, the SARB has cut its 2026 growth forecast to 1.2%, and the September PMI fell to 49.0, below the 50 mark that separates expansion from contraction.
Household budgets are also under pressure, with petrol reaching a record R30.25/l in October. If fuel costs push inflation higher and force another rate hike, banks and retailers would bear the brunt through weaker credit demand, rising bad debts and softer consumer spending.
Valuation is not a catalyst in itself either. S.A. has traded at a discount for most of the past decade, and cheap markets can stay cheap for long periods.
Closing the gap will depend on the catalysts set out above actually arriving, particularly further credit upgrades and a pickup in growth.
Finally, much of the return for a dollar-based investor depends on two volatile drivers, the rand (around R16.66/$) and the gold price. A reversal in either could rescind gains from the underlying equities.
Asset allocation outlook
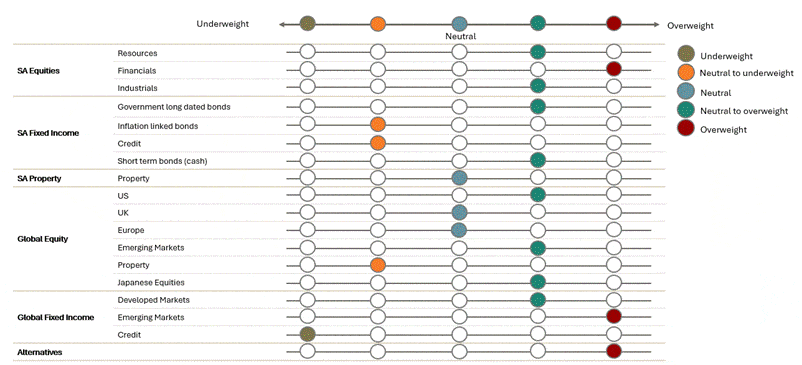
In S.A. equities, we see the biggest opportunity in financial services, particularly the banks. Higher interest rates widen the margin banks earn between what they pay depositors and what they charge borrowers, which supports earnings. The main risk is that rates rise far enough to push up bad debts, so asset quality is the key thing to monitor.
We remain positive on resource shares, which are benefiting from the commodity windfall, and on industrials, many of which earn offshore revenue that hedges against rand weakness.
In S.A. fixed income, higher interest rates have created an attractive yield opportunity in nominal government bonds and cash. We are negative on inflation-linked bonds. With the SARB targeting 3% and expecting inflation to fall back to that level by late 2027, the inflation protection these bonds offer is likely to be worth less than the higher yields available on nominal bonds. We are also negative on credit, where the additional yield over government bonds does not adequately compensate for the extra risk.
Exhibit 3 | OIG Asset Allocation as at October 2026
Source: OIG. Data as at 30 September 2026. For illustrative purposes only.
How to position
Our view favours an overweight position in the JSE on valuation grounds, funded from US mega-cap exposure. Given the weak domestic macro data, we suggest building the position gradually over two to three months rather than all at once. This lowers the risk of buying just before further disappointing news.
Within the market, we favour miners and rand-hedge stocks, which benefit directly from the commodity tailwind and offer some protection if the rand weakens.
Domestic banks and retailers are more exposed to the local economy and to rate pressure, so we would add to them once that pressure eases. For investors who want broad exposure, an All Share or SWIX index tracker is the lowest-cost way to capture the valuation discount.
The opportunity is compelling, but the path to unlocking it calls for patience, selectivity and a disciplined investment approach.

