

In July, Global markets were defined by the collapse of the Middle East ceasefire and a sharp unwind of the artificial intelligence (AI) trade. Renewed US strikes on Iran drove Brent Crude Oil roughly 23% higher, while investors pulled back from technology shares, sending the US NASDAQ 100 and Japan’s Nikkei sharply lower and lifting value-heavy markets such as the UK FTSE 100. Central banks held rates almost everywhere, but dissent grew, and long-dated bond yields rose.
South African assets held up comparatively well. The FTSE/JSE All Share Index (ALSI) gained 1.2% as resource shares rebounded with oil and platinum prices, leaving the local market well ahead of a falling global benchmark. Bonds and the currency went the other way, with the rand weakening towards R17.0 and the All Bond Index (ALBI) turning negative. June Inflation (CPI) accelerated to 5.0% to reach a two-year high, yet the South African Reserve Bank (SARB) held the repo rate at 7.0%.
LOCAL MARKETS
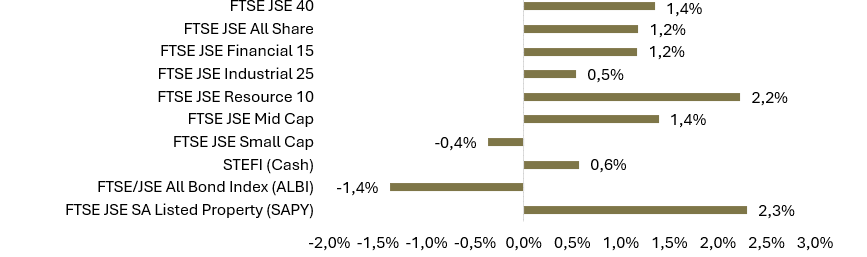
Exhibit 1 | Local Performance (ZAR) for July 2026
South Africa
Economy
South Africa’s inflation accelerated in June, with annual consumer prices rising to 5.0%, coming in above the 4.7% consensus forecast. It was the highest reading in two years. Transport was the largest contributor, with the annual rate for the category jumping to 12.7% from 9.4% as fuel prices climbed 34.3% over the twelve months to June. Electricity tariff increases of close to 10% added further pressure, and core inflation rose to 4.1% (its highest print since September 2024)
Against that backdrop, the Monetary Policy Committee’s (MPC) decision to hold the repo rate at 7.0% on 23 July surprised most economists, who had expected a 25-basis-point increase. Four members voted to hold, and two preferred a hike, leaving the prime lending rate at 10.5%. Governor Lesetja Kganyago called the inflation outlook slightly improved but still too high alongside weak growth.
South African equities ended July higher. The ALSI gained 1.2%, and the Top 40 rose 1.4%, in a month when most global markets fell.
Resource shares led, with the Resource 10 index up 2.2% as the oil price surged and platinum extended its rebound. Listed property was the strongest climber at 2.3%, while mid-caps (1.4%), financials (1.2%) and industrials (0.5%) also advanced. Small caps eased -0.4%.
Sector performance was broadly positive:
- Energy and platinum producers led the market, as the renewed Middle East conflict lifted the oil price and platinum-group metals extended the recovery that began late in the second quarter.
- Domestically focused retailers were the casualties. Food and clothing retailers fell as the fuel-driven jump in inflation and the SARB’s decision not to ease pointed to continued pressure on household budgets.
- South Africa outperformed emerging markets by a wide margin, with the ALSI’s 1.2% gain in sharp contrast with the MSCI Emerging Markets Index’s -6.6% decline.
Overall, July showed that the JSE’s commodity weighting can work in investors’ favour: the exposure that dragged the index down in June cushioned it in July. Local equities still trade at a substantial discount to emerging market peers.
Best performers:
Sasol: 20.2%
Valterra Platinum: 12.1
Investec plc: 11.3%
Investec Limited: 11.3%
Prosus: 7.8%
Worst performers:
MTN Group: – 10.1%
Woolworths: – 6.7%
AngloGold Ashanti: – 5.7%
Pepkor Holdings: – 3.7%
Shoprite: – 2.7%
Bond market and currency
The rand weakened in July as the oil price surge widened the import bill and the SARB’s decision to hold rates disappointed the market. The currency slid to R17.0 against the US dollar late in the month (marking its weakest level in three months) before ending July around R16.8 against the greenback, R19.2 against the euro and the pound.
Local bond markets gave back June’s gains. The SA 10-year yield rose to around 8.7% from 8.4% at the end of June, having briefly traded above 9.0% in the week of the rate decision. The 20-year yield ended near 9.1%.
The ALBI returned -1.4%, reversing June’s gain. Real yields remain attractive relative to global peers, but with headline and core inflation both above the top of the SARB’s target range, the risk of tightening at the 23 September MPC meeting has not gone away.
GLOBAL MARKETS
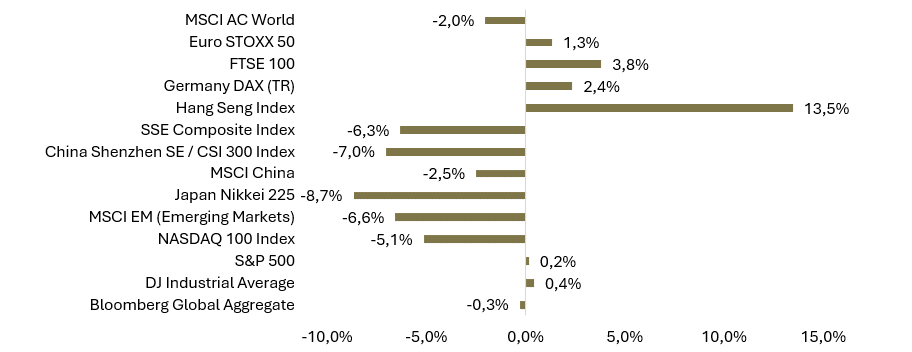
Global markets fell in July as two forces collided. The pause in fighting between the US and Iran broke down in the first half of the month, sending oil roughly 23% higher and reviving the energy-driven inflation fears that had eased in June. Investors simultaneously sold technology shares on concerns that AI spending had outrun returns. The MSCI All Country World Index (MSCI World) fell -2.0%, with markets carrying heavy energy, mining and financial exposure holding their ground and technology-heavy markets bearing the brunt.
Exhibit 2 | Global Performance (base currency) July 2026
Source: Factset. Data as at 31 July 2026. Past performance is not indicative of future performance. For illustrative purposes only and not indicative of any investment.
United States
US equity markets ended July mixed, with the gap between technology and everything else at its widest in months. The NASDAQ 100 fell -5.1% as investors cut semiconductor and AI-linked positions, while the S&P 500 was flat at 0.2% and the Dow Jones Industrial Average added 0.4% for a fourth consecutive monthly gain.
Concerns about the cost of the AI build-out drove much of the weakness, with two of the largest technology companies falling after reporting negative second-quarter free cash flow. Strong cloud results from Microsoft and Amazon turned sentiment late in the month.
The inflation picture improved, at least on paper. June CPI fell to 3.5% year-on-year from 4.2% in May, below the 3.8% expected, with prices down -0.4% over the month on a -5.7% drop in energy costs. Core inflation eased to 2.6%. Those figures predate July’s oil surge.
The Federal Reserve (Fed) held rates at 3.50% at the July Federal Open Market Committee (FOMC) meeting, the second under Chair Kevin Warsh. Three of the twelve voting members dissented in favour of a 25-basis-point increase.
The bond market read the decision as the Fed falling behind on inflation. Long-dated yields jumped, the 30-year Treasury yield reaching its highest level since 2007, and the Dow fell more than 1,100 points. Markets ended July pricing a meaningful chance of a September increase.
Europe
European equity markets were among the few to advance. Germany’s DAX Index gained 2.4%, and the Euro STOXX 50 rose 1.3%, helped by defence, energy and industrial shares. The region’s dependence on imported energy remains a vulnerability, but stronger-than-expected economic data offset the drag from higher oil.
The eurozone economy expanded 0.4% in the second quarter, doubling the 0.2% expected and its fastest pace since early 2025. Inflation moved the other way, accelerating to 2.9% in July. The European Central Bank (ECB) held its deposit rate at 2.25% on 23 July following June’s increase, and markets ended the month pricing two further hikes by early 2027.
United Kingdom
The UK was the strongest developed market. The FTSE 100 gained 3.8% and touched a fresh intraday record above 10,978 points on 30 July, lifted by defence and engineering earnings upgrades and by its heavy weighting in mining and energy shares. The Bank of England (BoE) voted six to three to keep rates at 3.75%, a fifth consecutive hold, and annual inflation eased to 2.6% in June (from 2.8%).
Asia
Asian markets were sharply divided. Japan’s Nikkei 225 fell -8.7%, its first monthly decline in four months, as the global retreat from AI and semiconductor shares hit the market’s largest constituents hardest, before a rebound in the final sessions. The Bank of Japan left its policy rate at 1.0%, the highest since 1995.
Hong Kong was the standout gainer globally, with the Hang Seng Index rising 13.5% as international investors returned to the large Chinese technology companies listed offshore. Mainland markets went the other way: the SSE Composite fell -6.3%, and the CSI 300 declined -7.0%, marking its worst month since 2021. MSCI China, which blends the two, eased -2.5%. China’s factory activity gauge slipped into contraction for the first time since February.
Emerging Markets (EM)
Emerging market equities fell hard in July, the MSCI Emerging Markets Index down -6.6% as weakness in mainland China and volatility in Korean and Taiwanese technology shares weighed on its largest constituents. The index nonetheless remains up 37.1% over the past twelve months.
Returns across the region were widely dispersed. Hong Kong-listed Chinese technology shares rallied while mainland indices fell, and Korean chipmakers swung sharply in both directions. South Africa was among the better performers.
Overall, July again reinforced the importance of regional differentiation within emerging markets. Commodity-linked markets benefited from the oil price surge, while markets dependent on technology earnings bore the brunt of the selling.
Commodities
Commodity markets were dominated by the return of the energy shock. Brent Crude Oil rose roughly 23% to end July at around $88/bbl, its strongest monthly gain since March, after briefly trading above $100 mid-month. The collapse of the US-Iran pause, renewed American strikes and a naval blockade near the Strait of Hormuz drove the move, undoing much of June’s inflation relief.
Precious metals steadied after a punishing second quarter. Gold rose around 1% to end the month at approximately $4,068/oz, its first monthly gain in five months, holding above $4,000 despite the firmer dollar and the prospect of higher US rates.
Platinum extended its recovery, rising 3.7% to around $1,659/oz, supporting South African producers, and silver ended at about $58/oz. Copper rose roughly 5% to $6.4 per pound on falling exchange inventories and demand from electrification and data centres.
Outlook
The macro narrative reversed course in July. What looked in June like the end of an energy shock has become a second one, and the fuel price relief South African consumers expected in the second half is now in doubt.
Central banks are now visibly divided. The Fed, the Bank of England (BoE), the ECB, the Bank of Japan and the SARB all held rates in July, and every one of those decisions drew dissenting votes for higher rates. Whether the Strait of Hormuz stays open remains the most important variable.
For South Africa, attention turns to the 23 September MPC meeting. The committee held in July by the narrowest workable margin, with two of six members favouring a hike. With headline inflation at 5.0%, core at 4.1% and oil sharply higher, the bar for a September increase looks lower than a month ago. Food prices are the risk to watch, given higher fertiliser and diesel costs.
The JSE’s commodity weighting remains the swing factor for local returns, and July showed it can cut both ways. A sustained oil price above $85 a barrel would support energy and mining shares while squeezing domestically focused retailers. Local valuations still sit at a substantial discount to emerging market peers.
In this environment, maintaining broad diversification across asset classes and regions remains essential. Quality, resilience and disciplined portfolio construction continue to be the most effective tools for navigating what remains an uncertain and event-driven market backdrop.

